A knowledgeable and educated public contributes to Canada's ability to meet
the innovative and competitive demands of the labour market.The majority (67%)
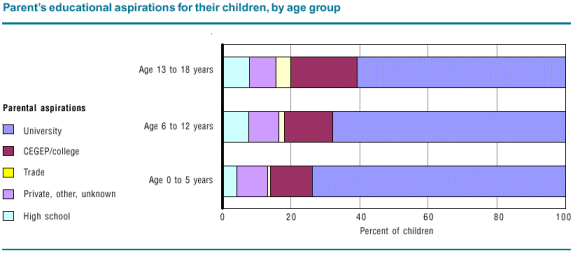
of Canadian parents have educational aspirations for their children that include
a university degree. An additional 15% identified CEGEP or college completion,
2% a trade certificate and 9% stated either private, other or an unknown level of
postsecondary education as their educational aspiration for their child.
Parents' educational plans for their children varied slightly according to the
sex of the child. A slightly larger proportion of male children were expected to go
no further than high school relative to female children (8% compared to 5%). At the
same time more consideration was given to the trades for male children (3.5%) than
for female children (1%*)3. On the other hand, a higher proportion of female children
had parents who expressed the hope that they would complete a university degree
(71%) than did male children (64%). Parental aspirations were similar for CEGEP/
college completions regardless of the sex of the child.
Parental hopes varied greatly according to parents' own level of educational
experience. As parental levels of education increased so too did their educational
aspirations for their children. Parents' educational aspirations for their children were
also mitigated by the child's age.
Eight in ten children had parents report that their child's grades were 70%
or higher in 2002 (14% at 90 or above, 32% between 80 and 89, 36% between 70
and 79). Nine in ten children were perceived by parents to either like school (73%)
or were neutral about school (16%) mirroring the overall positive attitudes parents
had towards their children's continued education, as discussed earlier. Only 11% of
children seemed to dislike school according to parents. Parental school performance
expectations were high. The parents of only about half the children (53%) believed
that their children were working to their full potential at school.
All public postsecondary institutions – colleges and institutes as well as
universities and degree-granting institutions - offer continuing education programs
aimed at adults either for general interest or to develop specific job skills. Such
programs vary in length from a few days to three years.
Savings behaviours
The proportion of children with savings for postsecondary
increased from 41% to 50% in three years.
Parental beliefs about education linked to saving behaviours.
About half of the children whose parents believed an education after high school
was important already had savings put aside for them in 2002. An additional 31%
expected to save in the future. Only 19% of children whose parents believed that an
education after high school was very important or important had parents who were
non-savers. This contrasts with children whose parents believed that an education
after high school was only somewhat or not important. In this group 35% had
savings set aside for them by parents, while 28% had parents who intended to save
in the future. More than a third (37%) of the children from this group had parents
who were non-savers.
Parental savings behaviours strongly tied to the child's age.
In general, parents' saving status was similar for male and female children, with one
exception. When the educational aspiration for male children was high school
completion, about 32% of parents were already saving and about 39% did not have
current savings, nor did they plan to save in the future (non-savers). On the other
hand, under the same conditions for female children, 26% had parents who were
currently saving and 45% had parents who were non-savers.
Children who were performing well in school were more likely to have savings.
The proportion of children with parents who were current savers declined both as
the child's grades dropped and as the child's attitudes towards school became more
negative. Almost six in ten children whose reported grades were 90% or higher had
parents who were already saving for their postsecondary education. This compares
to three in ten for children whose grades were below 60%. This pattern is repeated
when examining parents' saving status by children's attitudes to school. More than
half (52%) of the children who liked school had parents who were current savers,
while only 37% of the children who disliked school had parents who were saving.
Savings behaviours vary on a number of demographic and family characteristics.
Parents' savings status varied across provinces. Saskatchewan and Manitoba had
the highest proportion of children whose parents were current savers (59% and
56%, relative to 50% for Canada overall). Quebec had the lowest proportion of
children with parents who were saving (40%), perhaps related to the relatively
lower costs of attending CEGEP schools in Quebec. Prince Edward Island was
also below the Canadian average in proportion of current savers (45%), and had the
highest proportion of non-savers (24%) outside of Quebec.
Higher income groups had the highest share of current savers. Almost 7 in
ten children (68%) living in households with incomes of $85,000 or more were
currently being saved for at the time of the survey. This dropped steadily as income
levels decreased. Nevertheless, more than a quarter (26%) of children living in
households where the household income was less than $25,000 had parents who
were current savers. And almost half the children in this lowest income group (45%)
had parents who intended to start saving in the future.
With income levels tied closely to levels of educational attainment it is not
surprising to find that children in households where at least one parent was university
educated had the highest proportion of parents who were currently saving (63%).
However, 37% of children whose parents had only a high school education also
had savings already set aside for them.
The number of parents working seemed to matter more to the ability to save
than whether the child was from a single parent or a two parent family. Children in
two parent families where both parents were working were the most likely to have
savings set aside (58%). Children from two parent families with only one parent
working, and single parent working families, were below the Canadian average of
parents who were current savers, at 47% and 41% respectively. Children between
the ages of 0 and 18 in non-standard living arrangements (parent(s) not working or
older children living on their own) were well below the Canadian average in
proportion with parents who were saving (30%).About 80% of children aged 0 to 18
had parents who were either already saving or were intending to start saving in the future.
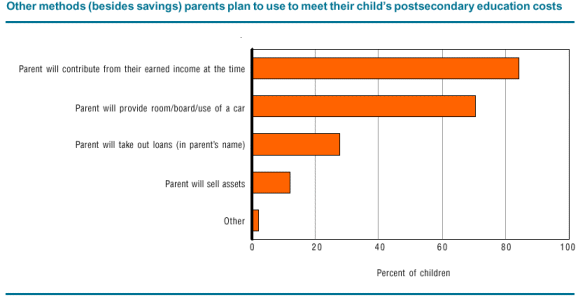
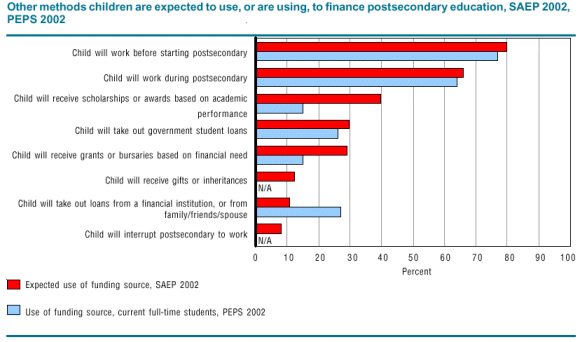
There were considerable levels of anticpated use of financial resources outside the family as well. About a third of this 13 to 18 year old group (29%) was expected to receive grants or bursaries based on financial need. Four in ten children were expected to receive scholarships or awards based on academic performance. Government student loans were expected to be used by 30% of 13-18 year olds who continued on to postsecondary and about 11% were expected to take out repayable loans from financial institutions or family and friends.
Post-secondary Education Participation Survey, 2002 (PEPS)
Survey of Approaches to Educational Planning (SAEP) 2002
Results from the Post-secondary Education Participation Survey, 2002 (PEPS), allow one to see how reasonable these parental financing expectations may be. PEPS asked full-time postsecondary students aged 18 to 24 to provide information on what sources they were using to fund their current academic year. Just over three-quarters of the PEPS population had worked before starting postsecondary and were using savings from past earnings to fund their current studies. About two-thirds (64%) were, in fact, working during their current academic year. Just over one-quarter of PEPS (26%) had received a government student loan for the current year. These figures were very close to Survey of Approaches to Educational Planning (SAEP) 2002 figures for each of these funding sources, although it must be remembered that SAEP looks at financing strategies over an entire problem of postsecondary studies while PEPS looks at strategies used for a current academic year only. The use of particular financial resources may vary across the postsecondary program years. (Figure 3 below).
The financing strategies used by PEPS respondents to fund their current academic year were substantially differant from those expected to be used by children in SAEP in three important areas. Only 15% of PEPS respondents had received grants or bursaries based on financial need (or about half of the 29% figure in SAEP). About the same proportion of PEPS respondents had received scholarships or awards based on academic performance, compared to the expected 40% in SAEP. The only identified financing strategy that had a lower expected usage in SAEP than was being experienced by current students in PEPS, was in the area of repayable loans from family, friends or financial institutions (11% and 27% respectively).
Not surprisingly, children whose parents had identified high school as the
educational goal for their children had the lowest median dollars saved to date at
$2,990. Median savings were highest when the parental educational hopes for the
child included a university degree at $4,960. Interesting patterns were evident in
the other savings preferences according to educational aspirations. About
93% of children expected to complete high school only had savings outside of
RESPs, while about 76% of those expected to complete university had savings
outside of RESPs. On the other hand, only 26% of children expected to complete
high school had RESP savings, while 58% of those expected to complete university
had RESP savings.
Household income was linked to the amount of money saved to date by
current savers, the savings strategies used, and the contributions to savings made in
2001. Children in households where the income was less than $25,000 had a median
amount of $2,400 saved to date by 2002. This almost tripled for the highest income
group where the median amount saved to date was $7,000. A much higher proportion
of children living in high income households had parents who were using RESP
plans to save, (61%) relative to children living in low income households (42%).
The median amount contributed in 2001 was almost three times higher for
households in the highest income bracket relative to those in the lowest income
bracket. Parent savers in households with incomes of less than $25,000 made a
median contribution of $590 in 2001, while those living in households with $85,000
or more in income contributed about $1,400.
Amounts expected to have saved for postsecondary education
As noted earlier, income was related to both the likelyhood that parents intended to save any money for their children's education and whether or not they were currently saving. It is not surprising, therefore, that income was also related to the amount that parents expected to have saved by the time their children became eligible for postsecondary enrolment.
Figure 4 (below) compares several distibrutions describing how much money parents who were currently saving expected to save for their children's postsecondary education. Each of the five differant lines represents a differant group of household income. Although the majority of the values Iindicated by the high peaks) were between $5000 and $25,000, the distributions indicate a great deal of variability in the expectations of parents.
For all income groups except the two highest, parents were most likely to expect around $10,000 in educational savings. Using education costs estimated from the Post-secondary Education Participation Survey, 2002 (PEPS), this equates to approximately 1 year of postsecondary education. However, very few parents in the lowest income category expected to save more than this amount. The steepness of the single peak for this group indicates that the parents in the lowest income group tended to be very similar in their expectations of savings.
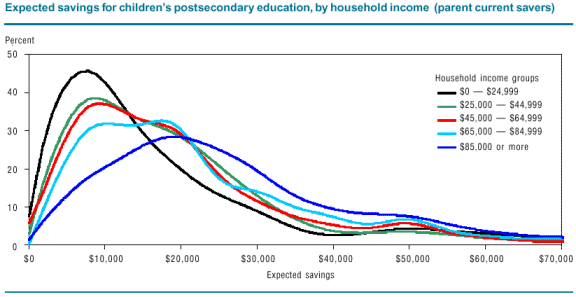
Not surprisingly, as household income increased, parents expected to save
increasingly higher amounts. While parents of children in the next two income
groups ($25,000-$64,999) also tended to be concentrated around $10,000, about
one in four children had parents who expected to save around $20,000, or the
equivalent of two years of postsecondary education.
However, the differences in savings expectations were not proportional to
the increases in income across the three lowest income groups. Although the
maximum household income level shifted by $40,000 for these three income groups,
parents were still most likely to expect around $10,000 in savings. Few parents in
any of the three lowest household income groups expected to save more than around
$20,000.
Children from the two highest income groups also had many parents
expecting savings around $10,000. Nonetheless, the most likely savings for children
living at the higher income levels was around $20,000.
There was a greater tendency for parents of children living at the highest
income level to expect savings around $30,000. However, even at the highest
income level, parents of two-thirds of the children still expected to save less than
$30,000. It appears that parents who were saving, even those at the highest income
levels, did not expect to save much more than the equivalent of two years of
postsecondary costs.
Interestingly, in each of the five income groups, there was a noticeable
percentage of parents who expected to save around $50,000. The percentage ranged
from approximately 2% to 7% between income groups and, except for the two
highest income groups, was larger than the percentage expecting to save around
$40,000. The presence of this small sub-population implies that, regardless of income,
there are some parents who expect to have sufficient savings to pay for the equivalent
of at least an undergraduate university degree.
The Above is a Summary of a Statistics Canada Report:
"A Survey of Approaches to Educational Planning (SAEP) 2002".
"Statistics Canada information is used with the permission of the Minister of Industry, as Minister responsible for Statistics Canada.
Information on the availability of the wide range of data from Statistics Canada can be obtained from Statistics Canada's Regional Offices,
its World Wide Web site at http://www.statcan.ca and its toll free access number 1-800-263-1136."
http://www.statcan.gc.ca
Click Right Here to Translate This Page
Clickez ICI Pour Traduire Cette Page
Courtesy of
![]()
|
SITE MAP
:: DISCLAIMER ::
RESP Statistics
Copyright © 2003-2010 www.resps.org